
How to Draw a Burndown Chart When You Have Multiple Deadlines
This article was automatically translated from Japanese by AI. Read the original Japanese version →
Table of Contents
In this post, I'll write about how to run a burndown chart in a project when you have a task group A with an upcoming deadline and a task group B with a later deadline. Please note that this is purely a suggestion—not some silver bullet guaranteed to make things go well.
What Is a Burndown Chart?
Are you familiar with burndown charts? Surprisingly, there wasn't even a Japanese Wikipedia article for it, so looking at Backlog's help guide, here's how it describes them:
It's a graph that lets you see at a glance "whether all the work can be finished by the deadline." A burndown chart plots "amount of work" on the vertical axis and "time" on the horizontal axis to show the remaining work. Since remaining work decreases as time passes, the graph slopes downward to the right.
Here is a rough chart I threw together in a spreadsheet. In this chart, the work fortunately finishes right on schedule.
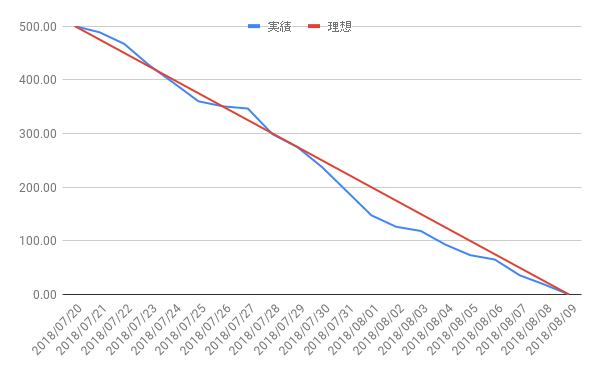
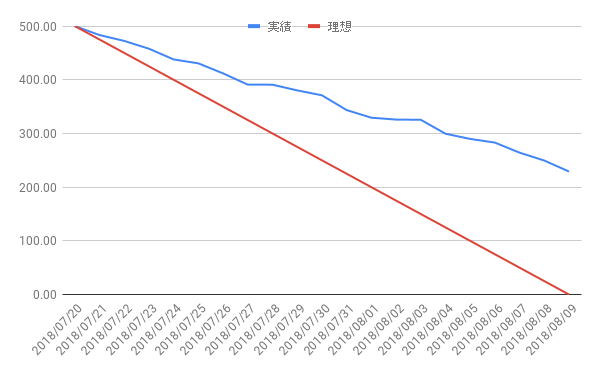
When progress isn't going well, it becomes immediately obvious because the actual line sits above the ideal line. An unfortunate project that won't finish on time looks like this:
What to Do When There Are Multiple Deadlines
Now, enough introduction—let's get to the main topic. Normally, burndown charts assume a team has a single large task with a single deadline (or milestone). You break that large task into smaller tasks and track their progress to gauge overall progress. In reality, though, things are rarely that neat. It's very common for a team to work on multiple tasks in parallel, each with a different deadline.
As mentioned at the start, how should you draw a burndown chart when you have a task group A with a closer deadline and a task group B with a further deadline? As a premise, we ignore priority between the two groups: both A and B must be completed, and if progress falls behind, the team will respond with overtime or adding more people.
First, what about drawing separate burndown charts for group A and group B? That doesn't work well—you don't even need a diagram to see why. Suppose group A's deadline is in 5 days with 4 days of remaining work, and group B's deadline is in 10 days with 8 days of remaining work. Individually, both look like they'll finish on time. But if you work on A first and then B, the total work is 12 days—so you'll miss group B's deadline by 2 days. If you maintain separate burndown charts, it's hard to notice this.
The simplest solution is to stack group B's burndown chart on top of group A's. In other words, put the group with the earlier deadline on the bottom, and stack the group with the later deadline on top. For example, like the chart below. In this chart, task A makes its deadline, while task B does not.
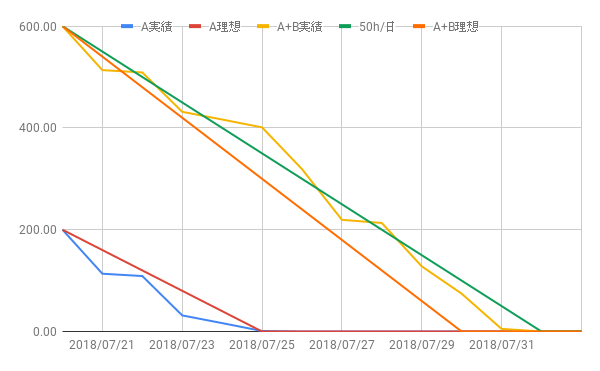
This chart reflects roughly the same scenario I just described. Assuming a team capacity of 50h/day, group A has 4 days of work (200h) to do in 5 days, and group B has 8 days of work (400h) to do in 10 days—meaning 600h total over 10 days. To finish group A alone, even a pace slower than expected (40h/day) is enough. However, to finish A + B, you need 60h/day. (To make this clearer, I drew a green reference line at 50h/day.)
In this chart, group A is neatly finished before group B begins, but the same chart works even when that's not the case. As long as you can view this at the team or individual level just like a regular burndown chart, you can spot velocity drops and capacity overruns the exact same way.
Sharp readers will notice there's no point drawing an ideal line for group B by itself, because while you're working on group A, group B makes no progress. Even if you work on them in parallel, B's actual line will naturally sit above B's standalone ideal line, so looking at that tells you nothing. If you've planned out how much effort to allocate to A versus B each day, you could draw a planned line (separate from the ideal line), though honestly few projects can plan that precisely.
I just hope whatever burndown chart tool you use supports outputting charts in this kind of format.